# Daily COVID-19 cases notification Pipeline with Knative Eventing, BigQuery, Matplotlib and SendGrid
Author: [Mete Atamel](https://atamel.dev/) | Published: 2020-06-15 | Topics: knative, kubernetes, eventing, google cloud, google kubernetes engine | Canonical: https://atamel.dev/posts/2020/06-15_daily-covid19-cases-notification-pipeline/
## Motivation
When I started working from home in mid-March, I was totally obsessed with
COVID-19 news. I was constantly checking number of cases and news from the UK
(where I currently live) and from Cyprus (where I'm originally from). It took me
a couple of weeks to realize how unproductive this was. I started limiting
myself to check for news once a day. This definitely helped me to regain sanity
and productivity but it was manual.
Then, in late March, I read about [COVID-19 public dataset
program](https://cloud.google.com/blog/products/data-analytics/free-public-datasets-for-covid19)
on BigQuery and [Lak Lakshmanan](https://twitter.com/lak_gcp)'s [Analyzing COVID-19 with
BigQuery](https://medium.com/google-cloud/analyzing-covid-19-with-bigquery-13701a3a785)
post where he shows how to query and plot data using this public dataset.
These two posts immediately gave me an idea: *How about I write an schedule driven
pipeline to query the COVID-19 cases from countries I care about, generate some
charts and send me an email once a day with those charts?*
## Initial design
It was clear from the beginning that I needed 3 services: one to query the data, one
to generate some charts from the data and another one to send email
notifications.
I decided to use Knative Eventing as the backbone of the event-driven
architecture. I explained in my [previous
post](../06-05_event-driven-image-processing-pipeline-knative) how Knative
`Eventing Sources`, `Broker` and `Trigger` model and custom `CloudEvents` is
great for event-driven architectures.
BigQuery supports the notion of [scheduled
queries](https://cloud.google.com/bigquery/docs/scheduling-queries) but after
playing it a little bit, it did not work as I expected. Maybe I did something
wrong but I found scheduled queries hard to work with and test.
Instead, I decided to
schedule queries myself by using `CloudScheduler` of Google Cloud. The good news
is that Knative Eventing has
[CloudSchedulerSource](https://github.com/google/knative-gcp/blob/master/docs/examples/cloudschedulersource/README.md)
which makes creating scheduled jobs and triggers easier.
For charting, I simply wanted to plot daily cases per country.
[Matplotlib](https://matplotlib.org/) is perfect for simple charting, so I
decided to go with that.
For email notifications, I decided to use [SendGrid](https://sendgrid.com/). Its
free tier was more than enough for my needs.
## Architecture
Here's the architecture of the pipeline. It uses [Knative
Eventing](https://knative.dev/docs/eventing/) and it's deployed to
Google Kubernetes Engine (GKE) on Google Cloud:
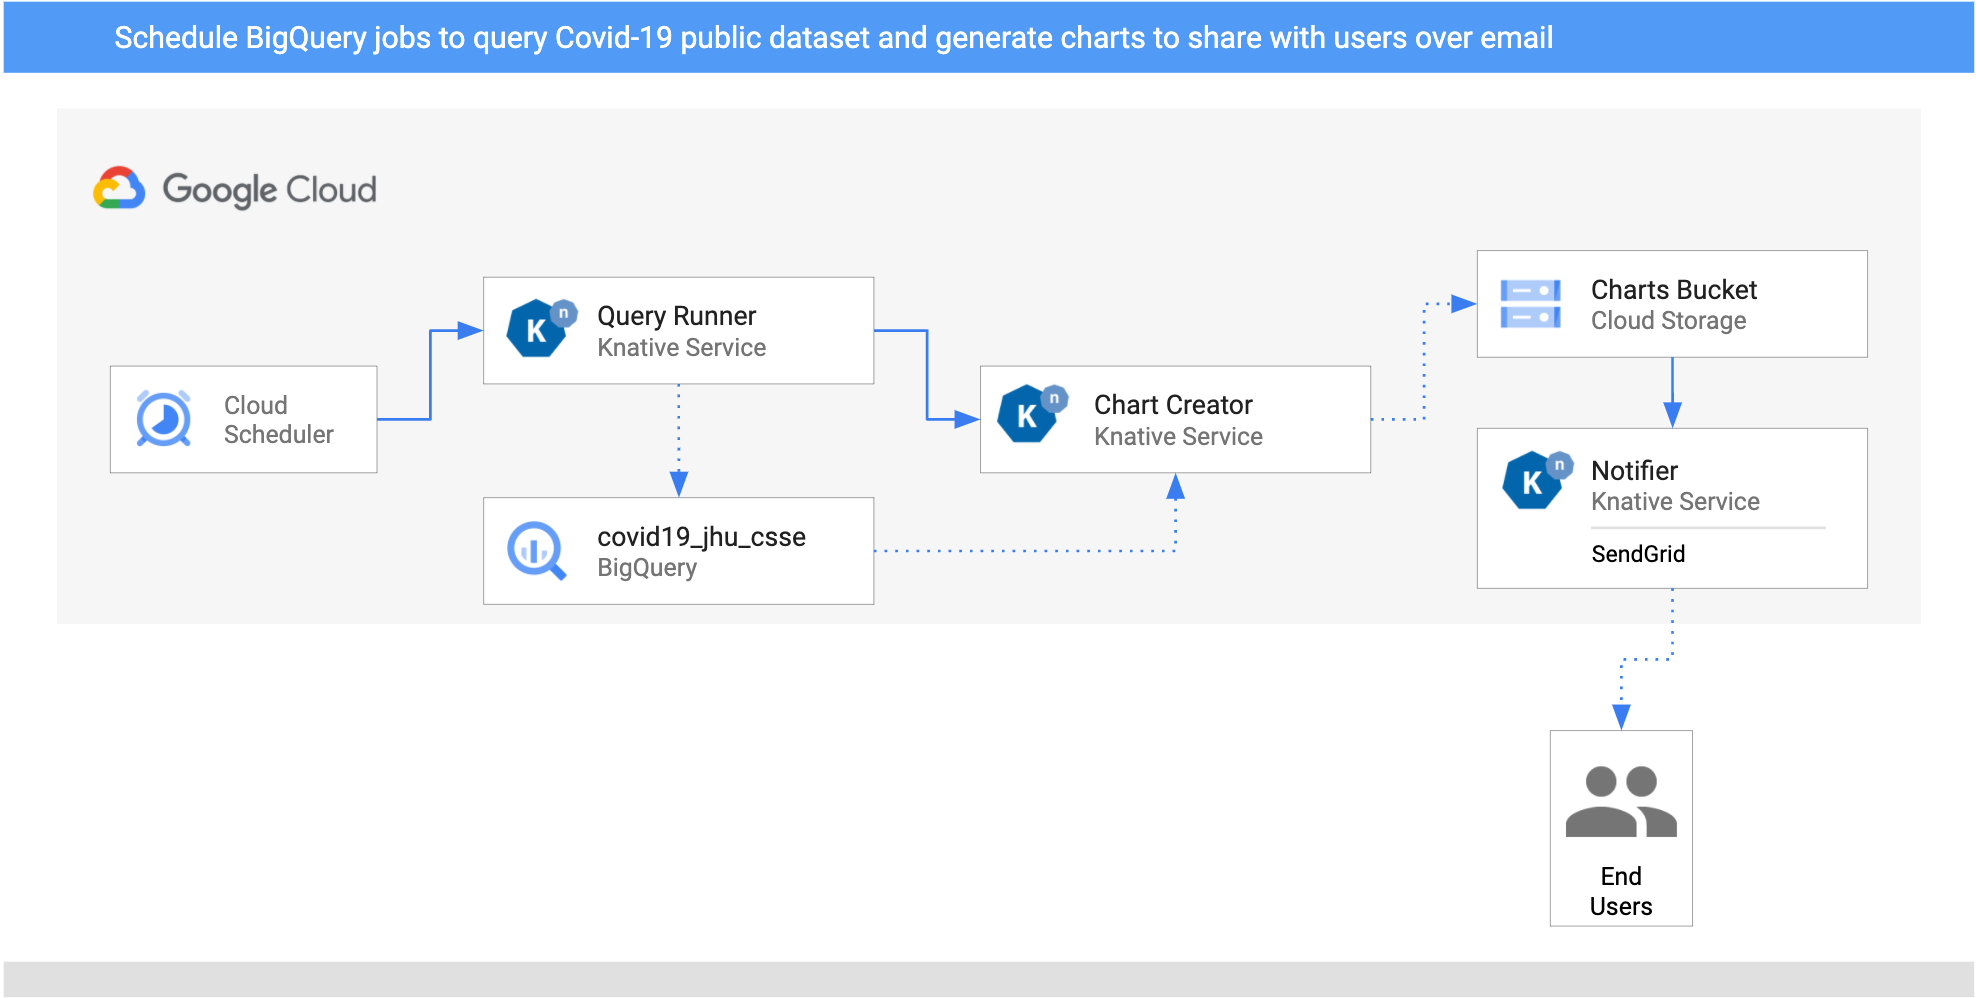
1. Two `CloudSchedulerSources` are setup for two countries (United Kingdom and
Cyprus) to call the `QueryRunner` service once a day.
2. `QueryRunner` service written in C#. It receives the scheduler event for both
countries, queries Covid-19 cases for the country using BigQuery's public
Covid-19 dataset and saves the result in a separate BigQuery table. Once
done, `QueryRunner` returns a custom `CloudEvent` of type
`dev.knative.samples.querycompleted`.
3. `ChartCreator` service written in Python. It receives the `querycompleted`
event, creates a chart from BigQuery data using `Matplotlib` and saves it to
a Cloud Storage bucket.
4. `Notifier` is another Python service that receives the
`com.google.cloud.storage.object.finalize` event from the bucket via a
`CloudStorageSource` and sends an email notification to users using SendGrid.
## Build the pipeline
I have [instructions](https://github.com/meteatamel/knative-tutorial/blob/master/docs/bigquery-processing-pipeline.md)
on how to build the pipeline and [code and
configuration](https://github.com/meteatamel/knative-tutorial/tree/master/eventing/processing-pipelines/bigquery)
in my [Knative Tutorial](https://github.com/meteatamel/knative-tutorial/). Let
me highlight the main parts here.
### Setup scheduler
To setup a daily schedule for United Kingdom and Cyprus, I created 2
`CloudSchedulerSources`. Let's take a look at one of them in
[schedulersource-uk.yaml](https://github.com/meteatamel/knative-tutorial/blob/master/eventing/processing-pipelines/bigquery/schedulersource-uk.yaml):
```yaml
apiVersion: events.cloud.google.com/v1alpha1
kind: CloudSchedulerSource
metadata:
name: schedulersource-uk
spec:
location: "europe-west1"
data: "United Kingdom"
schedule: "0 16 * * *"
sink:
ref:
apiVersion: eventing.knative.dev/v1beta1
kind: Broker
name: default
```
This sets up a CloudScheduler Job to send an event at 4pm every day. The data of
the `CloudEvent` has `United Kingdom` and it gets published the `Broker` in the
`default` namespace. A similar source is setup for Cyprus as well.
### Query Runner
This is a C# service that gets triggered by CloudScheduler execute events:
```yaml
apiVersion: eventing.knative.dev/v1beta1
kind: Trigger
metadata:
name: trigger-query-runner
spec:
filter:
attributes:
type: com.google.cloud.scheduler.job.execute
subscriber:
ref:
apiVersion: serving.knative.dev/v1
kind: Service
name: query-runner
```
It executes a query on BigQuery against one of the public datasets for the
passed in country and saves the results to an intermediate table:
```csharp
var sql = $@"SELECT date, SUM(confirmed) num_reports
FROM `bigquery-public-data.covid19_jhu_csse.summary`
WHERE country_region = '{country}'
GROUP BY date
ORDER BY date ASC";
var table = await GetOrCreateTable(client);
return await client.ExecuteQueryAsync(sql, null, new QueryOptions {
DestinationTable = table.Reference
});
```
### Chart Creator
This is a Python service that responds to `dev.knative.samples.querycompleted`
emitted by the `QueryService`.
It reads the data saved in the temporary table:
```python
query = f"""
SELECT
date, num_reports
FROM `covid19_jhu_csse.{tableId}`
ORDER BY date ASC"""
query_job = client.query(query)
results = query_job.result()
```
Converts the data to a Python's `DataFrame`:
```python
df = (
results
.to_dataframe()
)
```
Finally, plots the `DataFrame` with `Matplotlib`, saves to a file and uploads
the file to cloud storage:
```python
ax = df.plot(kind='line', x='date', y='num_reports')
ax.set_title(f'Covid Cases in {country}')
file_name = f'chart-{tableId}.png'
app.logger.info(f'Saving file locally: {file_name}')
plt.savefig(file_name)
upload_blob(file_name)
```
### Notifier
`Notifier` responds to new charts saved in the bucket. This means we need to setup
a `CloudStorageSource` to read those storage events to our namespace first and
then the [trigger.yaml](https://github.com/meteatamel/knative-tutorial/blob/master/eventing/processing-pipelines/bigquery/notifier/trigger.yaml) to direct them to `Notifier`:
```yaml
apiVersion: events.cloud.google.com/v1alpha1
kind: CloudStorageSource
metadata:
name: storagesource-charts
spec:
bucket: knative-atamel-charts
sink:
ref:
apiVersion: eventing.knative.dev/v1beta1
kind: Broker
name: default
```
The Knative Service definition,
[kservice.yaml](https://github.com/meteatamel/knative-tutorial/blob/master/eventing/processing-pipelines/bigquery/notifier/kservice.yaml),
has the email address to send notifications to and the SendGrid API key:
```yaml
apiVersion: serving.knative.dev/v1
kind: Service
metadata:
name: notifier
spec:
template:
spec:
containers:
- image: docker.io/meteatamel/notifier:v1
env:
- name: TO_EMAILS
value: "youremail@gmail.com"
- name: SENDGRID_API_KEY
value: "yoursendgrid_api_key"
```
Sending emails with SendGrid is just an API call:
```python
message = Mail(
from_email='noreply@bigquery-pipeline.com',
to_emails=to_emails,
subject='A new chart from BigQuery Pipeline',
html_content=f'A new chart is available for you to view: {image_url}
 ')
try:
app.logger.info(f"Email content {message}")
sg = SendGridAPIClient(os.environ.get('SENDGRID_API_KEY'))
response = sg.send(message)
app.logger.info(f"Email status code {response.status_code}")
except Exception as e:
print(e)
```
## Test the pipeline
Before testing the pipeline, let's make sure all the triggers are ready:
```bash
kubectl get trigger
NAME READY REASON BROKER SUBSCRIBER_URI
trigger-chart-creator True default http://chart-creator.default.svc.cluster.local
trigger-notifier True default http://notifier.default.svc.cluster.local
trigger-query-runner True default http://query-runner.default.svc.cluster.local
```
You can wait for Cloud Scheduler to trigger the services or you can manually
trigger the jobs.
Find the jobs IDs:
```bash
gcloud scheduler jobs list
ID LOCATION SCHEDULE (TZ) TARGET_TYPE STATE
cre-scheduler-2bcb33d8-3165-4eca-9428-feb99bc320e2 europe-west1 0 16 * * * (UTC) Pub/Sub ENABLED
cre-scheduler-714c0b82-c441-42f4-8f99-0e2eac9a5869 europe-west1 0 17 * * * (UTC) Pub/Sub ENABLED
```
Trigger one of the jobs:
```bash
gcloud scheduler jobs run cre-scheduler-2bcb33d8-3165-4eca-9428-feb99bc320e2
```
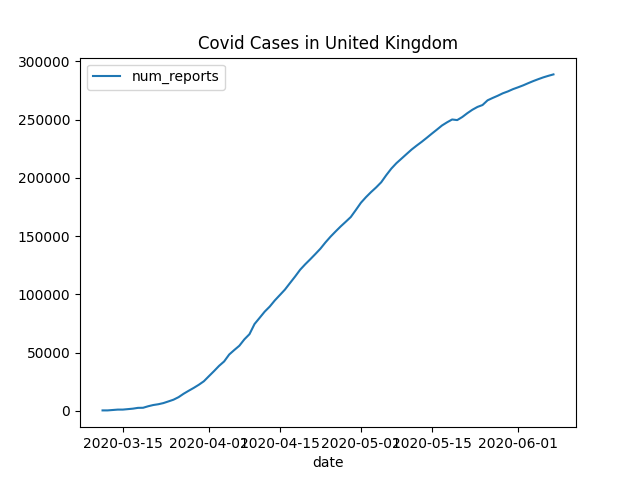
You should get an email with with a chart similar to this in a few minutes:
---
This wraps up my blog post. Hope this blog post gave you an idea on how to
connect unrelated services into an event-driven pipeline using Knative Eventing.
If you have questions/comments, feel free to reach out to me on
Twitter ([@meteatamel](https://twitter.com/meteatamel)).