The default metrics sent by Istio are useful to get an idea on how the traffic flows in your cluster. However, to understand how your application behaves, you also need application metrics.
Prometheus has client libraries that you can use to instrument your application and send those metrics. This is good but it raises some questions:
- Where do you collect those metrics?
- Do you use Istio’s Prometheus or set up your own Prometheus?
- If you use Istio’s Prometheus, what configuration do you need to get those metrics scraped?
Let’s try to answer these questions.
Istio vs. standalone Prometheus
In Prometheus, there’s a federation feature that allows a Prometheus server to scrape metrics from another Prometheus server. If you want to keep Istio metrics and application metrics separate, you can set up a separate Prometheus server for application metrics. Then, you can use federation to scrape those application metrics scraped with Istio’s Prometheus server.
A simpler approach is to scrape the application’s metrics using Istio’s Prometheus directly and that’s what I want to focus on here.
Sending application metrics
To send custom metrics from your application, you need to instrument your application using Prometheus’ client libraries. Which library to use depends on the language you’re using. As a C#/.NET developer, I used the .NET client for Prometheus and this blog post from Daniel Oliver has step-by-step instructions on how to send custom metrics from an ASP.NET Core application and see them in a local Prometheus server.
One thing you need to pay attention to is the port where you’re exposing your Prometheus metrics. In ASP.NETCore, the default port is 5000. When running locally, application metrics are exposed on localhost:5000/metrics. However, when you containerize your app, it’s common to expose your application over a different port, like 8080, and this becomes relevant later when we talk about configuration.
Assuming that you containerized and deployed your application on an Istio-enabled Kubernetes cluster, let’s now take a look at what we need to do to get these application metrics scraped by Istio’s Prometheus.
Configuration
In Istio 1.0.5, the default installation files for Kubernetes, istio-demo.yaml or istio-demo-auth.yaml, already have scraping configurations for Prometheus under a ConfigMap. You can just search for prometheus.yml. There are 2 scraping jobs that are relevant for application metrics:
\- job\_name: 'kubernetes-pods'
  kubernetes\_sd\_configs:
\- role: pod
...
\- job\_name: 'kubernetes-pods-istio-secure'
scheme: https
These are the jobs that scrape metrics from regular pods and pods where mTLS is enabled. It looks like Istio’s Prometheus should automatically scrape application metrics. However, in my first try, it didn’t work. I wasn’t sure what was wrong but Prometheus has some default endpoints:
/config: to see the current configuration of Prometheus./metrics: to see the scraped metrics./targets: to see the targets that’s being scraped and their status.
All of these endpoints are useful for debugging Prometheus:
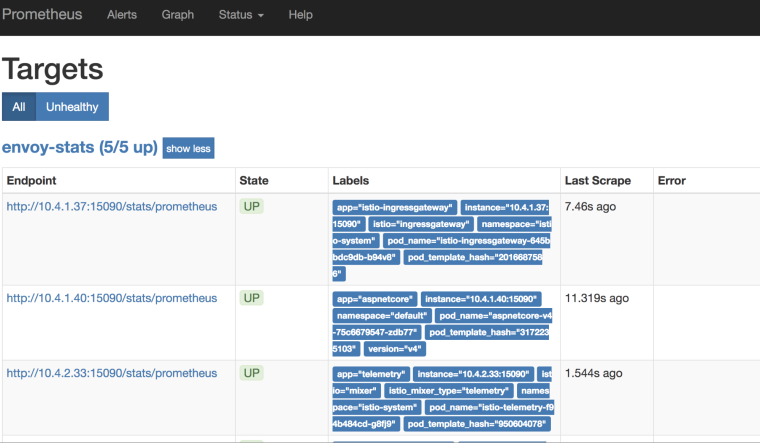
Turns out, I needed to add some annotations in my pod YAML files in order to get Prometheus scrape the pod. I had to tell Prometheus to scrape the pod and on which port with these annotations:
kind: Deployment
 metadata:
   name: aspnetcore-v4
 spec:
   replicas: 1
   template:
     metadata:
       labels:
         app: aspnetcore
         version: v4
       annotations:
 **        prometheus.io/scrape: "true"
** **        prometheus.io/port: "8080"**
After adding the annotations, I was able to see my application’s metrics in Prometheus:
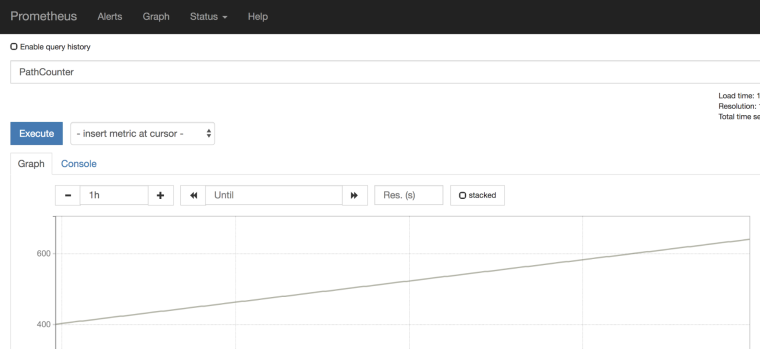
However, it was only working for regular pods and I was not able to see metrics with mTLS enabled between pods.
Issue with Istio certs and Prometheus
It’s not ideal but there’s an easy workaround: restart the Prometheus pod. Restart forces Prometheus to pick up certificates and the application’s metrics start flowing for mTLS enabled pods as well.
Conclusion
It’s worth noting that Mixer is being redesigned and, in future versions of Istio, it will be directly embedded in Envoy. In that design, you’ll be able to send application metrics through Mixer and it’ll flow through the same overall metrics pipeline of the sidecar. This should make it simpler to get application metrics working end to end.
Thanks to the Istio team and my coworker Sandeep Dinesh for helping me to debug through issues, as I got things working.
Originally published at meteatamel.wordpress.com on January 7, 2019.