Motivation
When I started working from home in mid-March, I was totally obsessed with COVID-19 news. I was constantly checking number of cases and news from the UK (where I currently live) and from Cyprus (where I’m originally from). It took me a couple of weeks to realize how unproductive this was. I started limiting myself to check for news once a day. This definitely helped me to regain sanity and productivity but it was manual.
Then, in late March, I read about COVID-19 public dataset program on BigQuery and Lak Lakshmanan’s Analyzing COVID-19 with BigQuery post where he shows how to query and plot data using this public dataset.
These two posts immediately gave me an idea: How about I write an schedule driven pipeline to query the COVID-19 cases from countries I care about, generate some charts and send me an email once a day with those charts?
Initial design
It was clear from the beginning that I needed 3 services: one to query the data, one to generate some charts from the data and another one to send email notifications.
I decided to use Knative Eventing as the backbone of the event-driven
architecture. I explained in my previous
post how Knative
Eventing Sources, Broker and Trigger model and custom CloudEvents is
great for event-driven architectures.
BigQuery supports the notion of scheduled queries but after playing it a little bit, it did not work as I expected. Maybe I did something wrong but I found scheduled queries hard to work with and test.
Instead, I decided to
schedule queries myself by using CloudScheduler of Google Cloud. The good news
is that Knative Eventing has
CloudSchedulerSource
which makes creating scheduled jobs and triggers easier.
For charting, I simply wanted to plot daily cases per country. Matplotlib is perfect for simple charting, so I decided to go with that.
For email notifications, I decided to use SendGrid. Its free tier was more than enough for my needs.
Architecture
Here’s the architecture of the pipeline. It uses Knative Eventing and it’s deployed to Google Kubernetes Engine (GKE) on Google Cloud:
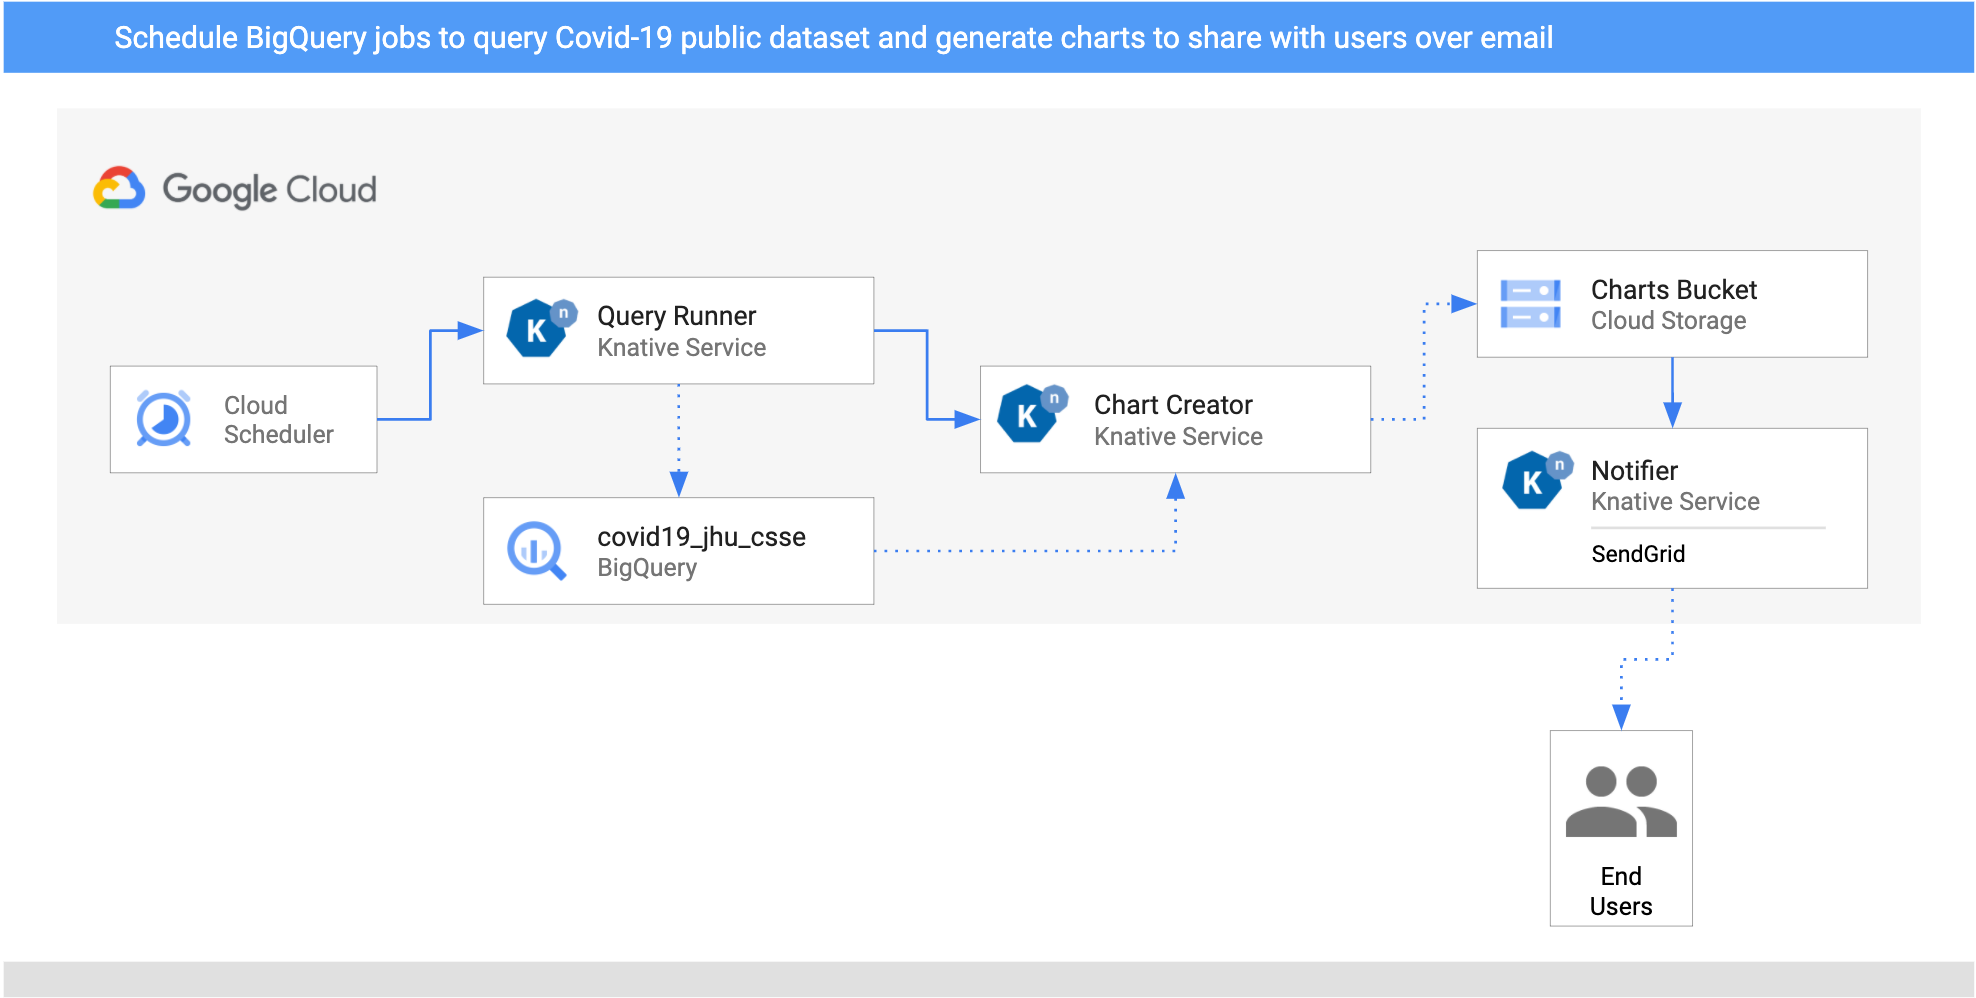
- Two
CloudSchedulerSourcesare setup for two countries (United Kingdom and Cyprus) to call theQueryRunnerservice once a day. QueryRunnerservice written in C#. It receives the scheduler event for both countries, queries Covid-19 cases for the country using BigQuery’s public Covid-19 dataset and saves the result in a separate BigQuery table. Once done,QueryRunnerreturns a customCloudEventof typedev.knative.samples.querycompleted.ChartCreatorservice written in Python. It receives thequerycompletedevent, creates a chart from BigQuery data usingMatplotliband saves it to a Cloud Storage bucket.Notifieris another Python service that receives thecom.google.cloud.storage.object.finalizeevent from the bucket via aCloudStorageSourceand sends an email notification to users using SendGrid.
Build the pipeline
I have instructions on how to build the pipeline and code and configuration in my Knative Tutorial. Let me highlight the main parts here.
Setup scheduler
To setup a daily schedule for United Kingdom and Cyprus, I created 2
CloudSchedulerSources. Let’s take a look at one of them in
schedulersource-uk.yaml:
apiVersion: events.cloud.google.com/v1alpha1
kind: CloudSchedulerSource
metadata:
  name: schedulersource-uk
spec:
  location: "europe-west1"
  data: "United Kingdom"
  schedule: "0 16 * * *"
  sink:
    ref:
      apiVersion: eventing.knative.dev/v1beta1
      kind: Broker
      name: default
This sets up a CloudScheduler Job to send an event at 4pm every day. The data of
the CloudEvent has United Kingdom and it gets published the Broker in the
default namespace. A similar source is setup for Cyprus as well.
Query Runner
This is a C# service that gets triggered by CloudScheduler execute events:
apiVersion: eventing.knative.dev/v1beta1
kind: Trigger
metadata:
  name: trigger-query-runner
spec:
  filter:
    attributes:
      type: com.google.cloud.scheduler.job.execute
  subscriber:
    ref:
      apiVersion: serving.knative.dev/v1
      kind: Service
      name: query-runner
It executes a query on BigQuery against one of the public datasets for the passed in country and saves the results to an intermediate table:
var sql = $@"SELECT date, SUM(confirmed) num_reports
      FROM `bigquery-public-data.covid19_jhu_csse.summary`
      WHERE country_region = '{country}'
      GROUP BY date
      ORDER BY date ASC";

var table = await GetOrCreateTable(client);
return await client.ExecuteQueryAsync(sql, null, new QueryOptions {
                 DestinationTable = table.Reference
             });
Chart Creator
This is a Python service that responds to dev.knative.samples.querycompleted
emitted by the QueryService.
It reads the data saved in the temporary table:
query = f"""
   SELECT
   date, num_reports
   FROM `covid19_jhu_csse.{tableId}`
   ORDER BY date ASC"""

query_job = client.query(query)

results = query_job.result()
Converts the data to a Python’s DataFrame:
df = (
   results
   .to_dataframe()
)
Finally, plots the DataFrame with Matplotlib, saves to a file and uploads
the file to cloud storage:
ax = df.plot(kind='line', x='date', y='num_reports')
ax.set_title(f'Covid Cases in {country}')

file_name = f'chart-{tableId}.png'
app.logger.info(f'Saving file locally: {file_name}')

plt.savefig(file_name)

upload_blob(file_name)
Notifier
Notifier responds to new charts saved in the bucket. This means we need to setup
a CloudStorageSource to read those storage events to our namespace first and
then the trigger.yaml to direct them to Notifier:
apiVersion: events.cloud.google.com/v1alpha1
kind: CloudStorageSource
metadata:
  name: storagesource-charts
spec:
  bucket: knative-atamel-charts
  sink:
    ref:
      apiVersion: eventing.knative.dev/v1beta1
      kind: Broker
      name: default
The Knative Service definition, kservice.yaml, has the email address to send notifications to and the SendGrid API key:
apiVersion: serving.knative.dev/v1
kind: Service
metadata:
  name: notifier
spec:
  template:
    spec:
      containers:
        - image: docker.io/meteatamel/notifier:v1
          env:
            - name: TO_EMAILS
              value: "youremail@gmail.com"
            - name: SENDGRID_API_KEY
              value: "yoursendgrid_api_key"
Sending emails with SendGrid is just an API call:
message = Mail(
   from_email='noreply@bigquery-pipeline.com',
   to_emails=to_emails,
   subject='A new chart from BigQuery Pipeline',
   html_content=f'A new chart is available for you to view: {image_url} <br><img src="{image_url}"/>')
try:
   app.logger.info(f"Email content {message}")
   sg = SendGridAPIClient(os.environ.get('SENDGRID_API_KEY'))
   response = sg.send(message)
   app.logger.info(f"Email status code {response.status_code}")
except Exception as e:
   print(e)
Test the pipeline
Before testing the pipeline, let’s make sure all the triggers are ready:
kubectl get trigger

NAME                    READY   REASON   BROKER    SUBSCRIBER_URI
trigger-chart-creator   True             default   http://chart-creator.default.svc.cluster.local
trigger-notifier        True             default   http://notifier.default.svc.cluster.local
trigger-query-runner    True             default   http://query-runner.default.svc.cluster.local
You can wait for Cloud Scheduler to trigger the services or you can manually trigger the jobs.
Find the jobs IDs:
gcloud scheduler jobs list

ID                                                  LOCATION      SCHEDULE (TZ)          TARGET_TYPE  STATE
cre-scheduler-2bcb33d8-3165-4eca-9428-feb99bc320e2  europe-west1  0 16 * * * (UTC)       Pub/Sub      ENABLED
cre-scheduler-714c0b82-c441-42f4-8f99-0e2eac9a5869  europe-west1  0 17 * * * (UTC)       Pub/Sub      ENABLED
Trigger one of the jobs:
gcloud scheduler jobs run cre-scheduler-2bcb33d8-3165-4eca-9428-feb99bc320e2
You should get an email with with a chart similar to this in a few minutes:
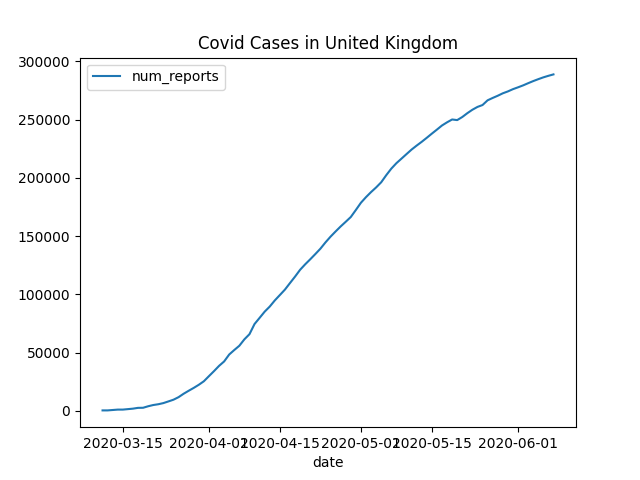
This wraps up my blog post. Hope this blog post gave you an idea on how to connect unrelated services into an event-driven pipeline using Knative Eventing. If you have questions/comments, feel free to reach out to me on Twitter (@meteatamel).